-

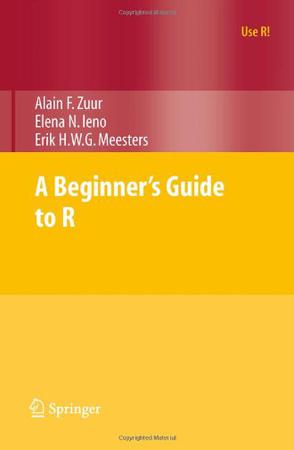
A Beginner's Guide to R
Based on their extensive experience with teaching R and statistics to applied scientists, the authors provide a beginner's guide to R. To avoid the difficulty of teaching R and statistics at the same time, statistical methods are kept to a minimum. The text covers how to download and install R, import and manage data, elementary plotting, an introduction to functions, advanced plotting, and common beginner mistakes. This book contains everything you need to know to get started with R. -

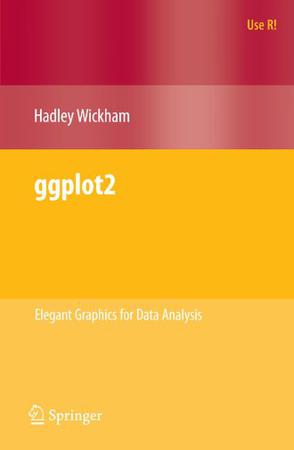
ggplot2
This book describes ggplot2, a new data visualization package for R that uses the insights from Leland Wilkison''s Grammar of Graphics to create a powerful and flexible system for creating data graphics. With ggplot2, it''s easy to: * produce handsome, publication-quality plots, with automatic legends created from the plot specification * superpose multiple layers (points, lines, maps, tiles, box plots to name a few) from different data sources, with automatically adjusted common scales * add customisable smoothers that use the powerful modelling capabilities of R, such as loess, linear models, generalised additive models and robust regression * save any ggplot2 plot (or part thereof) for later modification or reuse * create custom themes that capture in-house or journal style requirements, and that can easily be applied to multiple plots * approach your graph from a visual perspective, thinking about how each component of the data is represented on the final plot. This book will be useful to everyone who has struggled with displaying their data in an informative and attractive way. You will need some basic knowledge of R (i.e. you should be able to get your data into R), but ggplot2 is a mini-language specifically tailored for producing graphics, and you''ll learn everything you need in the book. After reading this book you''ll be able to produce graphics customized precisely for your problems, and you''ll find it easy to get graphics out of your head and on to the screen or page. -

Introduction to Time Series and Forecasting
Some of the key mathematical results are stated without proof in order to make the underlying theory accessible to a wider audience. The book assumes a knowledge only of basic calculus, matrix algebra, and elementary statistics. The emphasis is on methods and the analysis of data sets. The logic and tools of model-building for stationary and nonstationary time series are developed in detail and numerous exercises, many of which make use of the included computer package, provide the reader with ample opportunity to develop skills in this area. The core of the book covers stationary processes, ARMA and ARIMA processes, multivariate time series and state-space models, with an optional chapter on spectral analysis. Additional topics include harmonic regression, the Burg and Hannan-Rissanen algorithms, unit roots, regression with ARMA errors, structural models, the EM algorithm, generalized state-space models with applications to time series of count data, exponential smoothing, the Holt-Winters and ARAR forecasting algorithms, transfer function models and intervention analysis. Brief introductions are also given to cointegration and to nonlinear, continuous-time and long-memory models. The time series package included in the back of the book is a slightly modified version of the package ITSM, published separately as ITSM for Windows, by Springer-Verlag, 1994. It does not handle such large data sets as ITSM for Windows, but like the latter, runs on IBM-PC compatible computers under either DOS or Windows (version 3.1 or later). The programs are all menu-driven so that the reader can immediately apply the techniques in the book to time series data, with a minimal investment of time in the computational and algorithmic aspects of the analysis. -

Statistics
The resources that statisticians use directly affect people, government and society. Opinion polls influence political opinion; statistical evidence supports medical advances. In the sixth edition of his groundbreaking text, David Moore emphasizes the concepts and applications of statistics from a wide range of fields - encouraging students to see the meaning behind statistical results whilst retaining their interest. Moore's emphasis on ideas and data with minimal computation is generally acknowledged as the most effective way to teach non-mathematical students. -

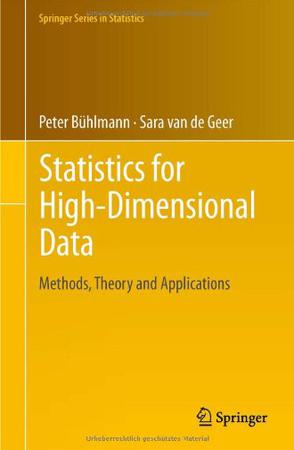
Statistics for High-Dimensional Data
Modern statistics deals with large and complex data sets, and consequently with models containing a large number of parameters. This book presents a detailed account of recently developed approaches, including the Lasso and versions of it for various models, boosting methods, undirected graphical modeling, and procedures controlling false positive selections. A special characteristic of the book is that it contains comprehensive mathematical theory on high-dimensional statistics combined with methodology, algorithms and illustrations with real data examples. This in-depth approach highlights the methods’ great potential and practical applicability in a variety of settings. As such, it is a valuable resource for researchers, graduate students and experts in statistics, applied mathematics and computer science. -

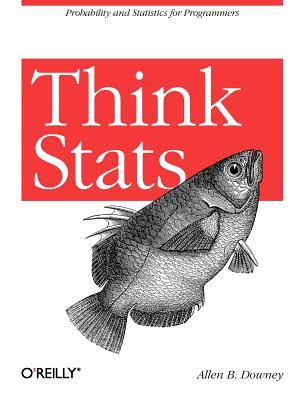
Think Stats
If you know how to program, you have the skills to turn data into knowledge using the tools of probability and statistics. This concise introduction shows you how to perform statistical analysis computationally, rather than mathematically, with programs written in Python. You'll work with a case study throughout the book to help you learn the entire data analysis process—from collecting data and generating statistics to identifying patterns and testing hypotheses. Along the way, you'll become familiar with distributions, the rules of probability, visualization, and many other tools and concepts. Develop your understanding of probability and statistics by writing and testing code Run experiments to test statistical behavior, such as generating samples from several distributions Use simulations to understand concepts that are hard to grasp mathematically Learn topics not usually covered in an introductory course, such as Bayesian estimation Import data from almost any source using Python, rather than be limited to data that has been cleaned and formatted for statistics tools Use statistical inference to answer questions about real-world data