-

R语言实战
数据时代已经到来,但数据分析、数据挖掘人才却十分短缺。由于“大数据”对每个领域的决定性影响, 相对于经验和直觉,在商业、经济及其他领域中基于数据和分析去发现问题并作出科学、客观的决策越来越重要。开源软件R是世界上最流行的数据分析、统计计算及制图语言,几乎能够完成任何数据处理任务,可安装并运行于所有主流平台,为我们提供了成千上万的专业模块和实用工具,是从大数据中获取有用信息的绝佳工具。 本书从解决实际问题入手,尽量跳脱统计学的理论阐述来讨论R语言及其应用,讲解清晰透澈,极具实用性。作者不仅高度概括了R语言的强大功能、展示了各种实用的统计示例,而且对于难以用传统方法分析的凌乱、不完整和非正态的数据也给出了完备的处理方法。通读本书,你将全面掌握使用R语言进行数据分析、数据挖掘的技巧,并领略大量探索和展示数据的图形功能,从而更加高效地进行分析与沟通。想要成为倍受高科技企业追捧的、炙手可热的数据分析师吗?想要科学分析数据并正确决策吗?不妨从本书开始,挑战大数据,用R开始炫酷的数据统计与分析吧! 本书内容: R安装与操作 数据导入/导出及格式化双变量关系的描述性分析回归分析 模型适用性的评价方法以及结果的可视化 用图形实现变量关系的可视化 在给定置信度的前提下确定样本量 高级统计分析方法和高级绘图 -

复杂数据统计方法
《复杂数据统计方法——基于r的应用》用自由的日软件分析30多个可以从国外网站下载的真实数据,包括横截面数据、纵向数据和时间序列数据,通过这些数据介绍了几乎所有经典方法及最新的机器学习方法。 《复杂数据统计方法——基于r的应用》特点:(1)以数据为导向;(2)介绍最新的方法(附有传统方法回顾);(3)提供r软件入门及全部例子计算的日代码及数据的网址;(4)各章独立。 《复杂数据统计方法——基于r的应用》的读者对象包括统计学、应用统计学、经济学、数学、应用数学、精算、环境、计量经济学、生物医学等专业的本科、硕士及博士生,各领域的教师和实际工作者。 -

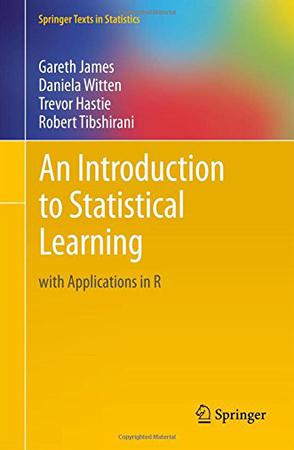
An Introduction to Statistical Learning
An Introduction to Statistical Learning provides an accessible overview of the field of statistical learning, an essential toolset for making sense of the vast and complex data sets that have emerged in fields ranging from biology to finance to marketing to astrophysics in the past twenty years. This book presents some of the most important modeling and prediction techniques, along with relevant applications. Topics include linear regression, classification, resampling methods, shrinkage approaches, tree-based methods, support vector machines, clustering, and more. Color graphics and real-world examples are used to illustrate the methods presented. Since the goal of this textbook is to facilitate the use of these statistical learning techniques by practitioners in science, industry, and other fields, each chapter contains a tutorial on implementing the analyses and methods presented in R, an extremely popular open source statistical software platform. Two of the authors co-wrote The Elements of Statistical Learning (Hastie, Tibshirani and Friedman, 2nd edition 2009), a popular reference book for statistics and machine learning researchers. An Introduction to Statistical Learning covers many of the same topics, but at a level accessible to a much broader audience. This book is targeted at statisticians and non-statisticians alike who wish to use cutting-edge statistical learning techniques to analyze their data. The text assumes only a previous course in linear regression and no knowledge of matrix algebra. -

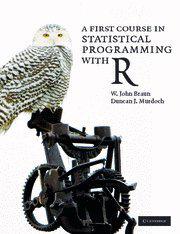
A First Course in Statistical Programming with R
This is the only introduction you'll need to start programming in R, the open-source language that is free to download, and lets you adapt the source code for your own requirements. Co-written by one of the R Core Development Team, and by an established R author, this book comes with real R code that complies with the standards of the language. Unlike other introductory books on the ground-breaking R system, this book emphasizes programming, including the principles that apply to most computing languages, and techniques used to develop more complex projects. Learning the language is made easier by the frequent exercises and end-of-chapter reviews that help you progress confidently through the book. Solutions, datasets and any errata will be available from the book's web site. The many examples, all from real applications, make it particularly useful for anyone working in practical data analysis. -

Lattice
R is rapidly growing in popularity as the environment of choice for data analysis and graphics both in academia and industry. Lattice brings the proven design of Trellis graphics (originally developed for S by William S. Cleveland and colleagues at Bell Labs) to R, considerably expanding its capabilities in the process. Lattice is a powerful and elegant high level data visualization system that is sufficient for most everyday graphics needs, yet flexible enough to be easily extended to handle demands of cutting edge research. Written by the author of the lattice system, this book describes it in considerable depth, beginning with the essentials and systematically delving into specific low levels details as necessary. No prior experience with lattice is required to read the book, although basic familiarity with R is assumed. The book contains close to150 figures produced with lattice. Many of the examples emphasize principles of good graphical design; almost all use real data sets that are publicly available in various R packages. All code and figures in the book are also available online, along with supplementary material covering more advanced topics. -

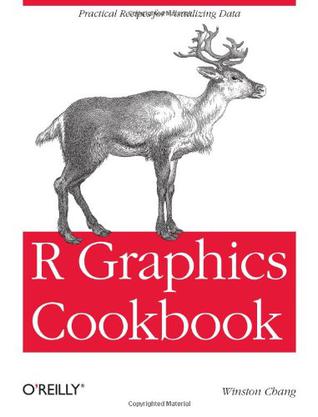
R Graphics Cookbook
This practical guide provides more than 150 recipes to help you generate high-quality graphs quickly, without having to comb through all the details of R's graphing systems. Each recipe tackles a specific problem with a solution you can apply to your own project, and includes a discussion of how and why the recipe works. Most of the recipes use the ggplot2 package, a powerful and flexible way to make graphs in R. If you have a basic understanding of the R language, you're ready to get started. Use R's default graphics for quick exploration of data Create a variety of bar graphs, line graphs, and scatter plots Summarize data distributions with histograms, density curves, box plots, and other examples Provide annotations to help viewers interpret data Control the overall appearance of graphics Render data groups alongside each other for easy comparison Use colors in plots Create network graphs, heat maps, and 3D scatter plots Structure data for graphing