-
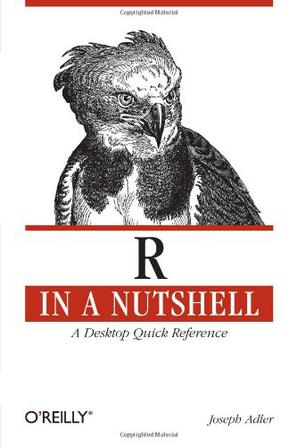
R in a Nutshell
R is rapidly becoming the standard for developing statistical software, and R in a Nutshell provides a quick and practical way to learn this increasingly popular open source language and environment. You'll not only learn how to program in R, but also how to find the right user-contributed R packages for statistical modeling, visualization, and bioinformatics. -
A Beginner's Guide to R
Based on their extensive experience with teaching R and statistics to applied scientists, the authors provide a beginner's guide to R. To avoid the difficulty of teaching R and statistics at the same time, statistical methods are kept to a minimum. The text covers how to download and install R, import and manage data, elementary plotting, an introduction to functions, advanced plotting, and common beginner mistakes. This book contains everything you need to know to get started with R. -
ggplot2
This book describes ggplot2, a new data visualization package for R that uses the insights from Leland Wilkison''s Grammar of Graphics to create a powerful and flexible system for creating data graphics. With ggplot2, it''s easy to: * produce handsome, publication-quality plots, with automatic legends created from the plot specification * superpose multiple layers (points, lines, maps, tiles, box plots to name a few) from different data sources, with automatically adjusted common scales * add customisable smoothers that use the powerful modelling capabilities of R, such as loess, linear models, generalised additive models and robust regression * save any ggplot2 plot (or part thereof) for later modification or reuse * create custom themes that capture in-house or journal style requirements, and that can easily be applied to multiple plots * approach your graph from a visual perspective, thinking about how each component of the data is represented on the final plot. This book will be useful to everyone who has struggled with displaying their data in an informative and attractive way. You will need some basic knowledge of R (i.e. you should be able to get your data into R), but ggplot2 is a mini-language specifically tailored for producing graphics, and you''ll learn everything you need in the book. After reading this book you''ll be able to produce graphics customized precisely for your problems, and you''ll find it easy to get graphics out of your head and on to the screen or page. -
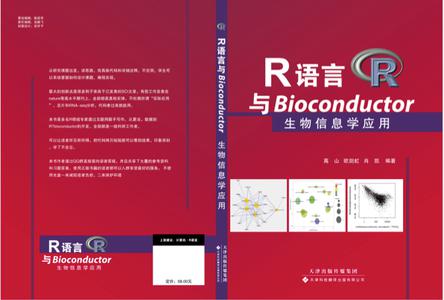
R语言与Bioconductor生物信息学应用
-

Graphical Models with R
Graphical models in their modern form have been around since the late 1970s and appear today in many areas of the sciences. Along with the ongoing developments of graphical models, a number of different graphical modeling software programs have been written over the years. In recent years many of these software developments have taken place within the R community, either in the form of new packages or by providing an R interface to existing software. This book attempts to give the reader a gentle introduction to graphical modeling using R and the main features of some of these packages. In addition, the book provides examples of how more advanced aspects of graphical modeling can be represented and handled within R. Topics covered in the seven chapters include graphical models for contingency tables, Gaussian and mixed graphical models, Bayesian networks and modeling high dimensional data. -
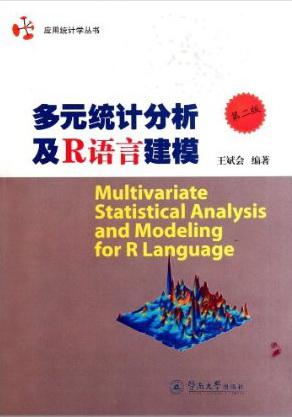
多元统计分析及R语言建模
《多元统计分析及R语言建模(第2版)》共分14章,主要内容有:多元数据的收集和整理、多元数据的直观显示、线性与非线性模型及广义线性模型、判别分析、聚类分析、主成分分析、因子分析、对应分析、典型相关分析等常见的主流方法。《多元统计分析及R语言建模(第2版)》还参考国内外大量文献,系统地介绍了这些年在经济管理等领域应用颇广的一些较新方法,可作为统计学专业本科生和研究生的多元分析课程教材。