-
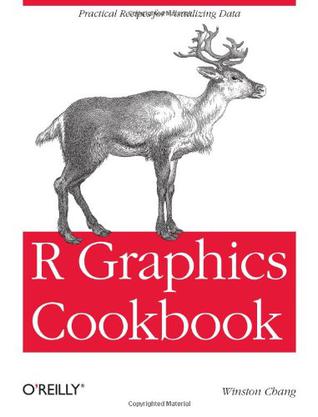
R Graphics Cookbook
This practical guide provides more than 150 recipes to help you generate high-quality graphs quickly, without having to comb through all the details of R's graphing systems. Each recipe tackles a specific problem with a solution you can apply to your own project, and includes a discussion of how and why the recipe works. Most of the recipes use the ggplot2 package, a powerful and flexible way to make graphs in R. If you have a basic understanding of the R language, you're ready to get started. Use R's default graphics for quick exploration of data Create a variety of bar graphs, line graphs, and scatter plots Summarize data distributions with histograms, density curves, box plots, and other examples Provide annotations to help viewers interpret data Control the overall appearance of graphics Render data groups alongside each other for easy comparison Use colors in plots Create network graphs, heat maps, and 3D scatter plots Structure data for graphing -
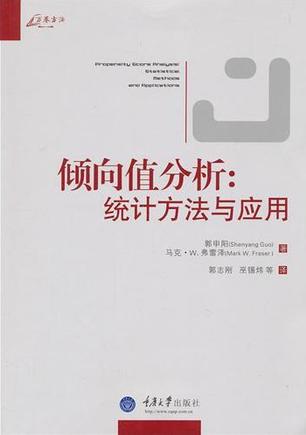
倾向值分析
本书阐述了重要的统计学原理和定理, 省略了论证, 通俗易懂, 侧重应用,是社会行为科学研究者了解当代前沿因果分析方法的重要工具书。本书系统介绍了四种用于因果分析的前沿统计方法: (1)由2000年诺贝尔经济学得主美国芝加哥大学教授杰姆斯• 海科曼(James Heckman)创立的 “样本选择模型”; (2)由美国宾夕法尼亚大学沃顿商学院著名统计学教授保罗• 罗森堡(Paul Rosenbaum)及哈佛大学著名统计学教授唐纳德•鲁宾(Donald Rubin )创立的“倾向值匹配方法”; (3)由美国哈佛大学肯尼迪政府学院教授埃尔波特• 阿贝蒂(Alberto Abadie )及哈佛大学经济学教授圭多•因本斯(Guido Imbens )创立的 “匹配估算法”; (4)由美国芝加哥大学教授杰姆斯•海科曼(James Heckman),日本东京大学经济学教授市村英彦(Hidehiko Ichimura),及美国宾夕法尼亚大学经济学教授派彻•托德(Petra Todd ) 创立的 “核心值匹配法”。该书将所有例证的Stata 操作程序和资料公布于互联网, 以方便读者练习和运用。 示例数据下载请登录:http://ssw.unc.edu/psa/ -
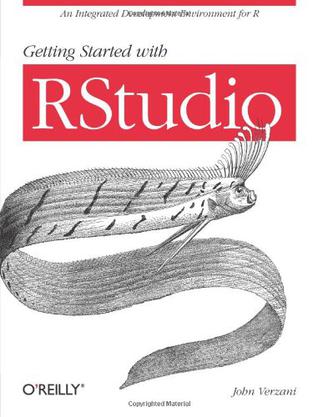
Getting Started with RStudio
This e-book will introduce users to the RStudio framework for using and programming R, the widely used open source statistical computing environment. The RStudio framework, is an open source project that brings together many powerful coding tools into an intuitive interface. It runs under all major platforms (Windows, Mac, Linux) and through a web browser (using the server installation). This text should appeal to newer R users and students who want to explore the interface to get the most out of R and to older R users who want to use a more modern looking development environment. The book will serve as both a resource to look up specific features provided by RStudio and as an introduction to the following processes with R: data analysis, programming and report generation. -
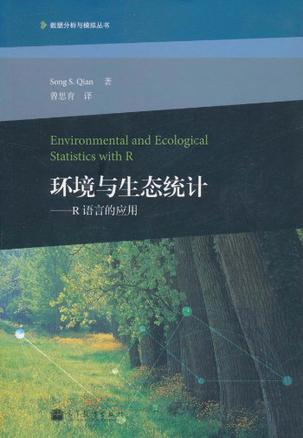
环境与生态统计
《环境与生态统计:R语言的应用》内容简介:在强调统计思维的归纳性本质基础上,《环境与生态统计:R语言的应用》把应用统计学跟环境与生态领域关联到一起。《环境与生态统计:R语言的应用》遵循解决统计建模问题的一般方法。内容覆盖了模型界定、参数估值和模型评估。作者用了很多实例来阐述统计学模型以及如何用R语言来实现模型。《环境与生态统计:R语言的应用》首先为开展简单的数据分析任务提供了基础知识。例如探索性数据分析和线性回归模型拟合。接下来重点介绍了统计建模,包括线性和非线性模型、分类和回归树以及广义线性模型。书中还讨论了用于模型检验的模拟,为开发出的模型提供评估工具,同时探讨了多层回归模型这类会对环境和生态学数据分析产生广泛影响的模型。 《环境与生态统计:R语言的应用》重点针对的是环境和生态学问题的统计建模和数据分析。通过引导读者理解解决科学问题和开发统计模型的过程,轻松地从科学假设过渡到统计模型。 -
R in Action
The ability to interpret and act on the massive amounts of information locked in web and enterprise systems is critical to success in the modern business economy. R, a free software environment for statistical computing and graphics, is a comprehensive package that empowers developers and analysts to capture, process, and respond intelligently to statistical information. R in Action is the first book to present both the R system and the use cases that make it such a compelling package for business developers. The book begins by introducing the R language, and then moves on to various examples illustrating R's features. Coverage includes data mining methodologies, approaches to messy data, R's extensive graphical environment, useful add-on modules, and how to interface R with other software platforms and data management systems. -
Statistics for Business and Economics
Discover how the most trusted approach to statistics today is Simply Powerful with the latest market-leading text from respected authors Anderson/Sweeney/Williams. STATISTICS FOR BUSINESS AND ECONOMICS, 11e introduces sound statistical methodology within a strong applications setting. The authors clearly demonstrate how statistical results provide insights into business decisions and present solutions to contemporary business problems. New cases and more than 350 real business examples and memorable exercises, 150 of which are new in this edition, present the latest statistical data and business information. With this book's comprehensive coverage and unwavering accuracy, you select the topics best for your course, including thorough coverage of the latest versions of MiniTab 15 and Excel 2007, along with StatTools and other leading Excel 2007 statistical add-ins within chapter appendices. Author-written support materials and CengageNOW online course management system provides time-saving, complete support to ensure student understanding. Choose Anderson/Sweeney/Williams' STATISTICS FOR BUSINESS AND ECONOMICS, 11e for the Simply Powerful statistical solution you need for your course.