-

Statistical Analysis with R
This is a practical, step by step guide that will help you to quickly become proficient in the data analysis using R. The book is packed with clear examples, screenshots, and code to carry on your data analysis without any hurdle. If you are a data analyst, business or information technology professional, student, educator, researcher, or anyone else who wants to learn to analyze the data effectively then this book is for you. No prior experience with R is necessary. Knowledge of other programming languages, software packages, or statistics may be helpful, but is not required. -

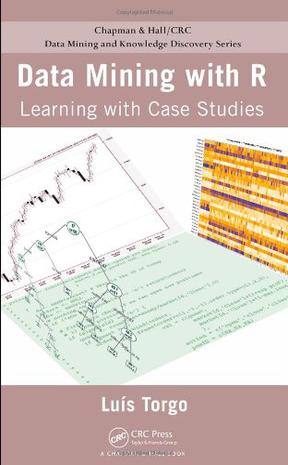
Data Mining with R
The versatile capabilities and large set of add-on packages make R an excellent alternative to many existing and often expensive data mining tools. Exploring this area from the perspective of a practitioner, Data Mining with R: Learning with Case Studies uses practical examples to illustrate the power of R and data mining. Assuming no prior knowledge of R or data mining/statistical techniques, the book covers a diverse set of problems that pose different challenges in terms of size, type of data, goals of analysis, and analytical tools. To present the main data mining processes and techniques, the author takes a hands-on approach that utilizes a series of detailed, real-world case studies: Predicting algae blooms Predicting stock market returns Detecting fraudulent transactions Classifying microarray samples With these case studies, the author supplies all necessary steps, code, and data. Web Resource A supporting website mirrors the do-it-yourself approach of the text. It offers a collection of freely available R source files that encompass all the code used in the case studies. The site also provides the data sets from the case studies as well as an R package of several functions. -

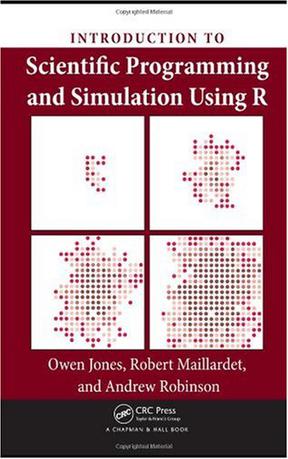
Introduction to Scientific Programming and Simulation Using R
Known for its versatility, the free programming language R is widely used for statistical computing and graphics, but is also a fully functional programming language well suited to scientific programming. An Introduction to Scientific Programming and Simulation Using R teaches the skills needed to perform scientific programming while also introducing stochastic modelling. Stochastic modelling in particular, and mathematical modelling in general, are intimately linked to scientific programming because the numerical techniques of scientific programming enable the practical application of mathematical models to real-world problems. Following a natural progression that assumes no prior knowledge of programming or probability, the book is organised into four main sections: * Programming In R starts with how to obtain and install R (for Windows, MacOS, and Unix platforms), then tackles basic calculations and program flow, before progressing to function based programming, data structures, graphics, and object-oriented code * A Primer on Numerical Mathematics introduces concepts of numerical accuracy and program efficiency in the context of root-finding, integration, and optimization * A Self-contained Introduction to Probability Theory takes readers as far as the Weak Law of Large Numbers and the Central Limit Theorem, equipping them for point and interval estimation * Simulation teaches how to generate univariate random variables, do Monte-Carlo integration, and variance reduction techniques In the last section, stochastic modelling is introduced using extensive case studies on epidemics, inventory management, and plant dispersal. A tried and tested pedagogic approach is employed throughout, with numerous examples, exercises, and a suite of practice projects. Unlike most guides to R, this volume is not about the application of statistical techniques, but rather shows how to turn algorithms into code. It is for those who want to make tools, not just use them. -

Introductory Time Series with R
Yearly global mean temperature and ocean levels, daily share prices, and the signals transmitted back to Earth by the Voyager space craft are all examples of sequential observations over time known as time series. This book gives you a step-by-step introduction to analysing time series using the open source software R. Each time series model is motivated with practical applications, and is defined in mathematical notation. Once the model has been introduced it is used to generate synthetic data, using R code, and these generated data are then used to estimate its parameters. This sequence enhances understanding of both the time series model and the R function used to fit the model to data. Finally, the model is used to analyse observed data taken from a practical application. By using R, the whole procedure can be reproduced by the reader. All the data sets used in the book are available on the website http://www.massey.ac.nz/~pscowper/ts. The book is written for undergraduate students of mathematics, economics, business and finance, geography, engineering and related disciplines, and postgraduate students who may need to analyse time series as part of their taught programme or their research. Paul Cowpertwait is a senior lecturer in statistics at Massey University with a substantial research record in both the theory and applications of time series and stochastic models. Andrew Metcalfe is an associate professor in the School of Mathematical Sciences at the University of Adelaide, and an author of six statistics text books and numerous research papers. Both authors have extensive experience of teaching time series to students at all levels. -

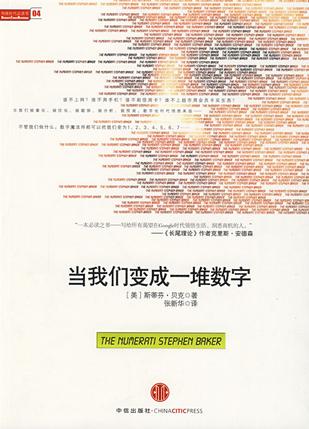
当我们变成一堆数字
《当我们变成一堆数字》讲述了:每一天,我们的身后都拖着一条由个人信息组成的长长的“尾巴”,这只是因为我们生活在一个现代化的世界。我们——点击网页、 切换电视频道、驾车穿过自动收费站、 用信用卡购物、使用手机, 而雅虎、Google这样的公司,正在以平均每人、每月2500条信息的速度,捕获我们的详细数据。是谁在关注这些数据?他们打算用这些数据来干吗?这正是美国《新闻周刊》资深记者斯蒂芬·贝克在这本极具魅惑力的书里所探究的问题,而他的回答既让人惊讶,又令人不安。一群新兴的数学精英,正千方百计地以惊人的准确性,剖析我们的每个举动,预测我们的行动计划。他们神不知鬼不觉地,将我们买了什么、对什么感兴趣、与谁坠入爱河的人间风光尽收眼底,就是为了巧妙地操控我们的行为。在这本汇聚数字报告和分析的力作里,斯蒂芬·贝克展示了一个我们正在进入的鲜活的世界,告诉我们谁在支配人类。数字科学家渗透了人世间的每个领域,将我们描绘为工薪族、购物者、选民、博主、潜藏的恐怖分子、病患者,甚至是恋人。他们在公司洞察我们的电子邮件和电话记录,来推测有多少员工真正在为公司的盈利添砖加瓦。他们分析我们的购买行为,以搞清我们是在节衣缩食、瘦身,还是有新的理财计划。从IBM、Google、保险公司到奥巴马竞选团队,莫不重金礼聘身怀绝技的“数字搜客”,从一大堆数字符码中过滤出宝贵的趋势和观点……。 -

重构大数据统计
基于《重构大数据统计》内容开发的数据分析工具已经在阿里巴巴集团内部的多个部门使用,并取得显著效果。 大数据的统计计算是进行数据探索和分析挖掘的基础,在实际应用中会遇到两个问题:一个是需要使用多少资源;另一个是计算时间,它关系到数据探索分析的效率和效果。 人们都希望花更少的钱,并且希望计算时间更短,但对于某个确定的计算过程,它们是成反比的。《重构大数据统计》就是从统计计算的算法入手,重构其计算过程,从而同时降低资源使用量和计算时间。 《重构大数据统计》提出了一套完整的关于大数据统计的计算理论,包括常用的各种统计量和统计方法。 《重构大数据统计》提供大量的示例程序代码帮助读者进一步了解算法细节,便于将书中的方法运用于实际计算。 《重构大数据统计》适合对大数据分析感兴趣的读者阅读:前面章节比较容易理解,包含了常用统计量的计算;后面的各章节需要读者具备一些基础知识。建议读者根据自己的兴趣和工作需要,选择相应的内容参考。