-
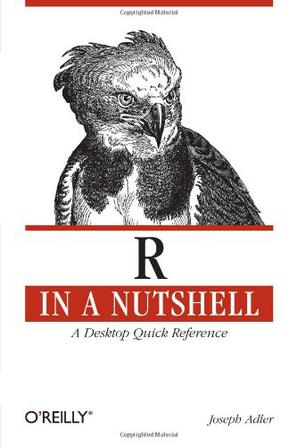
R in a Nutshell
R is rapidly becoming the standard for developing statistical software, and R in a Nutshell provides a quick and practical way to learn this increasingly popular open source language and environment. You'll not only learn how to program in R, but also how to find the right user-contributed R packages for statistical modeling, visualization, and bioinformatics. -
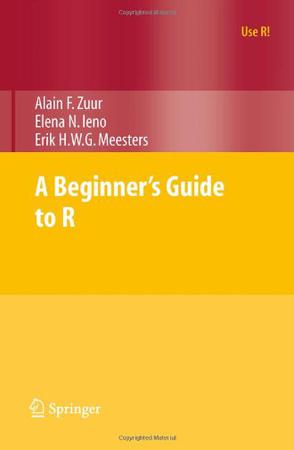
A Beginner's Guide to R
Based on their extensive experience with teaching R and statistics to applied scientists, the authors provide a beginner's guide to R. To avoid the difficulty of teaching R and statistics at the same time, statistical methods are kept to a minimum. The text covers how to download and install R, import and manage data, elementary plotting, an introduction to functions, advanced plotting, and common beginner mistakes. This book contains everything you need to know to get started with R. -
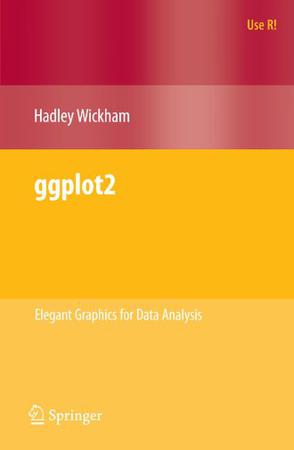
ggplot2
This book describes ggplot2, a new data visualization package for R that uses the insights from Leland Wilkison''s Grammar of Graphics to create a powerful and flexible system for creating data graphics. With ggplot2, it''s easy to: * produce handsome, publication-quality plots, with automatic legends created from the plot specification * superpose multiple layers (points, lines, maps, tiles, box plots to name a few) from different data sources, with automatically adjusted common scales * add customisable smoothers that use the powerful modelling capabilities of R, such as loess, linear models, generalised additive models and robust regression * save any ggplot2 plot (or part thereof) for later modification or reuse * create custom themes that capture in-house or journal style requirements, and that can easily be applied to multiple plots * approach your graph from a visual perspective, thinking about how each component of the data is represented on the final plot. This book will be useful to everyone who has struggled with displaying their data in an informative and attractive way. You will need some basic knowledge of R (i.e. you should be able to get your data into R), but ggplot2 is a mini-language specifically tailored for producing graphics, and you''ll learn everything you need in the book. After reading this book you''ll be able to produce graphics customized precisely for your problems, and you''ll find it easy to get graphics out of your head and on to the screen or page. -
统计学
统计作为数据分析的一种通用语言,为使用者提供了一套获取数据、分析数据并从数据中得出结论的原则和方法。本书内容包括描述统计、推断统计、多元统计和非参数统计等主要方法。写法上完全立足于统计应用,力求通俗易懂,每种方法都从实际问题入手进行讨论,尽可能避免统计公式的推导。书中例题的解答结合使用了Excel和SPSS两个软件,并给出每种方法的详细操作步骤,使读者能轻松完成统计计算。本书可作为高等院校经济管理类专业本科生统计学课程的教材使用,也可作为研究生和MBA的教材或参考书,对广大实际工作者也极具参考价值。 -

应用线性回归模型
《应用线性回归模型(第4版影印版)》从McGrawHill出版公司引进,共分三部分,内容包括:第一部分:简单线性回归:一元预测函数的线性回归,回归影响和相关分析,诊断及补救措施,即时推断和回归分析的其它几个专题,简单线性回归分析中的矩阵方法;第二部分:多元线性回归:多元回归Ⅰ,多元回归2,定性回归模型和定量预测,建立线性回归模型Ⅰ:模型选择及有效性,建立线性回归模型Ⅱ:诊断,建立线性回归模型Ⅲ:补救措施,时间序列数据中的自相关;第三部分:非线性回归:非线性回归和神经网络方法。《应用线性回归模型(第4版影印版)》篇幅适中,例子多涉及各个应用领域,在介绍统计思想方面比较突出,光盘数据丰富。《应用线性回归模型(第4版影印版)》适用于高等院校统计学专业和理工科各专业本科生和研究生作为教材使用。 -
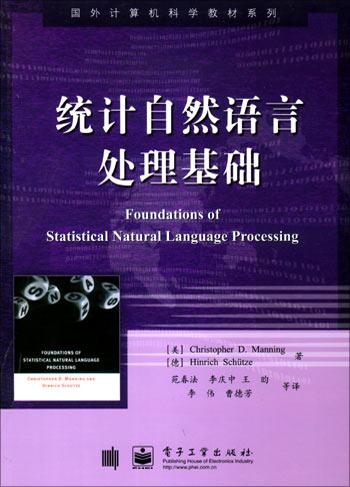
统计自然语言处理基础
《统计自然语言处理基础:国外计算机科学教材系列》是一本全面系统地介绍统计自然语言处理技术的专著,被国内外许多所著名大学选为计算语言学相关课程的教材。《统计自然语言处理基础:国外计算机科学教材系列》涵盖的内容十分广泛,分为四个部分,共16章,包括了构建自然语言处理软件工具将用到的几乎所有理论和算法。全书的论述过程由浅入深,从数学基础到精确的理论算法,从简单的词法分析到复杂的语法分析,适合不同水平的读者群的需求。同时,《统计自然语言处理基础:国外计算机科学教材系列》将理论与实践紧密联系在一起,在介绍理论知识的基础上给出了自然语言处理技术的高层应用(如信息检索等)。在《统计自然语言处理基础:国外计算机科学教材系列》的配套网站上提供了许多相关资源和工具,便于读者结合书中习题,在实践中获得提高。近年来,自然语言处理中的统计学方法已经逐渐成为主流。